반응형
막대그래프로 분류확률 및 분류 결과 시각화 완료
import os
import tensorflow.compat.v1 as tf
#os.environ['TF_CPP_MIN_LOG_LEVEL'] = '3'
#os.environ["CUDA_VISIBLE_DEVICES"] = "0"
#tf.debugging.set_log_device_placement(True)
from SyncRNG import SyncRNG
import pandas as pd
import matplotlib.pyplot as plt
import numpy as np
from sklearn.preprocessing import LabelEncoder
# 데이터 불러오기
raw_data = pd.read_csv('E:/GoogleDrive/포트폴리오/A5팀 R과 Python기반 머신러닝과 딥러닝 분석 비교(12월22일)/dataset/iris.csv')
class_names = ['Setosa','Versicolor','Virginica']
# 데이터 셋 7:3 으로 분할
v=list(range(1,len(raw_data)+1))
s=SyncRNG(seed=38)
ord=s.shuffle(v)
idx=ord[:round(len(raw_data)*0.7)]
# R에서는 데이터프레임이 1부터 시작하기 때문에
# python에서 0행과 R에서 1행이 같은 원리로
# 같은 인덱스 번호를 가진다면 -1을 해주어 같은 데이터를 가지고 오게 한다.
# 인덱스 수정-R이랑 같은 데이터 가져오려고
for i in range(0,len(idx)):
idx[i]=idx[i]-1
# 학습데이터, 테스트데이터 생성
train=raw_data.loc[idx] # 70%
#train=train.sort_index(ascending=True)
test=raw_data.drop(idx) # 30%
x_train = np.array(train.iloc[:,0:4], dtype=np.float32)
y_train = np.array(train.Species.replace(['setosa','versicolor','virginica'],[0,1,2]))
x_test = np.array(test.iloc[:,0:4], dtype=np.float32)
y_test = np.array(test.Species.replace(['setosa','versicolor','virginica'],[0,1,2]))
y_train_encoded = tf.keras.utils.to_categorical(y_train)
y_test_encoded = tf.keras.utils.to_categorical(y_test)from tensorflow.keras.models import Sequential
from tensorflow.keras.layers import Dense
model = Sequential()
model.add(Dense(3, input_dim=4, activation='softmax'))
model.compile(loss='categorical_crossentropy', optimizer='adam', metrics=['accuracy'])
history = model.fit(x_train, y_train_encoded, epochs=100, batch_size=2, validation_data=(x_test, y_test_encoded))
epochs = range(1, len(history.history['accuracy']) + 1)
plt.plot(epochs, history.history['loss'])
plt.plot(epochs, history.history['val_loss'])
plt.title('model loss')
plt.ylabel('loss')
plt.xlabel('epoch')
plt.legend(['train', 'pred'], loc='upper left')
plt.show()
print("\n 테스트 loss: %.4f" % (model.evaluate(x_test, y_test_encoded)[0]))
print("\n 테스트 accuracy: %.4f" % (model.evaluate(x_test, y_test_encoded)[1]))Epoch 1/100
53/53 [==============================] - 0s 5ms/step - loss: 1.7069 - accuracy: 0.3333 - val_loss: 1.5693 - val_accuracy: 0.3333
Epoch 2/100
53/53 [==============================] - 0s 4ms/step - loss: 1.4060 - accuracy: 0.3333 - val_loss: 1.3205 - val_accuracy: 0.3333
Epoch 3/100
53/53 [==============================] - 0s 3ms/step - loss: 1.2165 - accuracy: 0.3238 - val_loss: 1.1537 - val_accuracy: 0.3111
Epoch 4/100
53/53 [==============================] - 0s 3ms/step - loss: 1.0954 - accuracy: 0.1810 - val_loss: 1.0489 - val_accuracy: 0.3111
Epoch 5/100
53/53 [==============================] - 0s 3ms/step - loss: 1.0117 - accuracy: 0.1714 - val_loss: 0.9780 - val_accuracy: 0.1778
...
Epoch 95/100
53/53 [==============================] - 0s 4ms/step - loss: 0.3868 - accuracy: 0.9143 - val_loss: 0.3853 - val_accuracy: 0.9556
Epoch 96/100
53/53 [==============================] - 0s 3ms/step - loss: 0.3839 - accuracy: 0.9143 - val_loss: 0.3840 - val_accuracy: 0.9333
Epoch 97/100
53/53 [==============================] - 0s 3ms/step - loss: 0.3826 - accuracy: 0.8952 - val_loss: 0.3826 - val_accuracy: 0.9333
Epoch 98/100
53/53 [==============================] - 0s 3ms/step - loss: 0.3815 - accuracy: 0.8952 - val_loss: 0.3804 - val_accuracy: 0.9333
Epoch 99/100
53/53 [==============================] - 0s 3ms/step - loss: 0.3820 - accuracy: 0.9143 - val_loss: 0.3792 - val_accuracy: 0.9333
Epoch 100/100
53/53 [==============================] - 0s 3ms/step - loss: 0.3781 - accuracy: 0.9048 - val_loss: 0.3769 - val_accuracy: 0.9333
2/2 [==============================] - 0s 3ms/step - loss: 0.3769 - accuracy: 0.9333

 테스트 loss: 0.3769
2/2 [==============================] - 0s 3ms/step - loss: 0.3769 - accuracy: 0.9333

 테스트 accuracy: 0.9333
import matplotlib.pyplot as plt
history_dict = history.history
history_dict.keys()
acc = history_dict['accuracy']
val_acc = history_dict['val_accuracy']
loss = history_dict['loss']
val_loss = history_dict['val_loss']

epochs = range(1, len(acc) + 1)

# "bo"는 "파란색 점"입니다
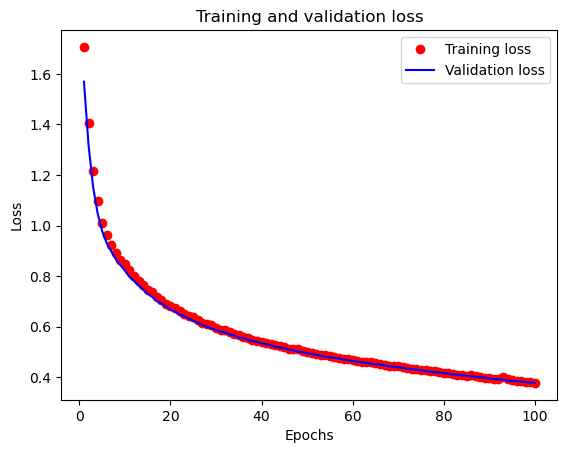
plt.plot(epochs, loss, 'ro', label='Training loss')
# b는 "파란 실선"입니다
plt.plot(epochs, val_loss, 'b', label='Validation loss')
plt.title('Training and validation loss')
plt.xlabel('Epochs')
plt.ylabel('Loss')
plt.legend()
plt.show()

plt.clf()   # 그림을 초기화합니다
plt.plot(epochs, acc, 'r', label='Training acc')
plt.plot(epochs, val_acc, 'y', label='Validation acc')
plt.title('Training and validation accuracy')
plt.xlabel('Epochs')
plt.ylabel('Accuracy')
plt.legend()
plt.show()


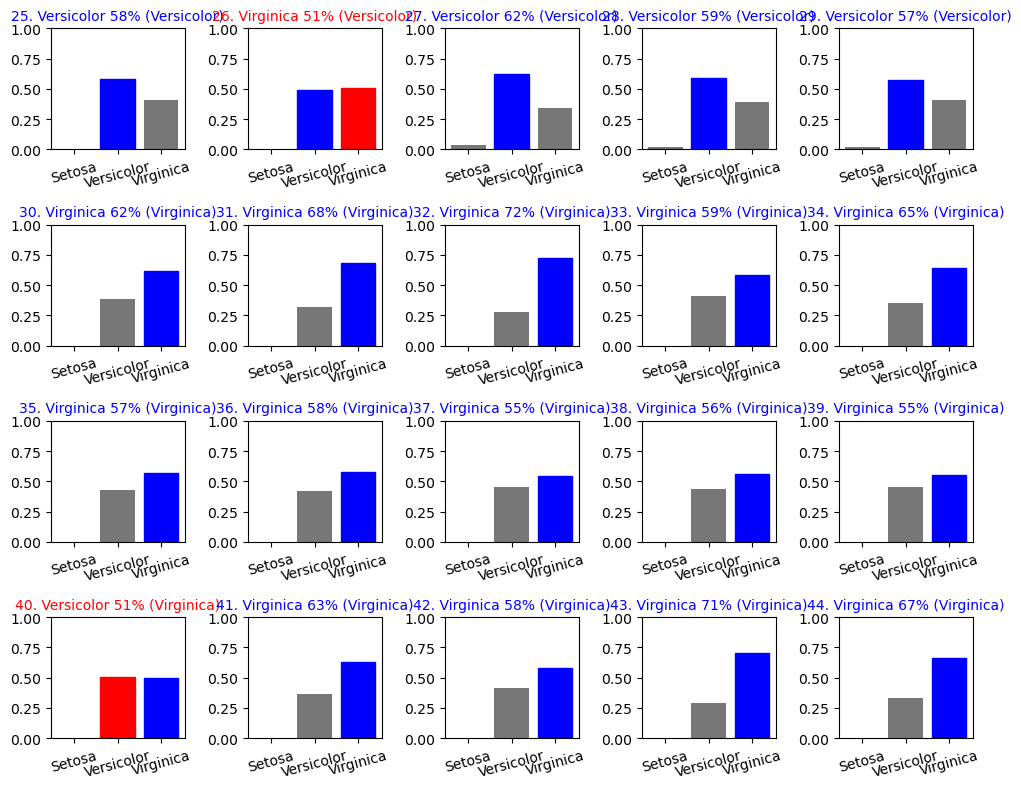
###예측 시각화
def plot_value_array(i, predictions_array, true_label):
  true_label = true_label[i]
  plt.grid(False)
  plt.xticks(range(3),class_names,rotation=15)

  thisplot = plt.bar(range(3), predictions_array, color="#777777")
  plt.ylim([0, 1])
  predicted_label = np.argmax(predictions_array)
  title_font = {
      'fontsize': 10,
  }
  if predicted_label == true_label:
    color = 'blue'
  else:
    color = 'red'


  plt.title("{}. {} {:2.0f}% ({})".format(i,class_names[predicted_label],
                                100*np.max(predictions_array),
                                class_names[true_label]),
                                color=color,fontdict=title_font)
  thisplot[predicted_label].set_color('red')
  thisplot[true_label].set_color('blue')


predictions=model.predict(x_test)

####0~24
num_rows = 5
num_cols = 5
num_table = num_rows*num_cols
plt.figure(figsize=(2*num_cols, 2*num_rows))
for i in range(num_table):
    plt.subplot(num_rows, num_cols,i+1)
    plot_value_array(i, predictions[i], y_test)
plt.tight_layout()
plt.show()


####25~44
num_rows = 4
num_cols = 5
num_table = num_rows*num_cols
plt.figure(figsize=(2*num_cols, 2*num_rows))
for i in range(num_table):
    plt.subplot(num_rows, num_cols,i+1)
    plot_value_array(i+25, predictions[i+25], y_test)
    if i>=19:
        break
plt.tight_layout()
plt.show()

from sklearn.metrics import classification_report
result=[np.argmax(x) for x in predictions]
print(classification_report( result, y_test))
2/2 [==============================] - 0s 2ms/step


              precision    recall  f1-score   support

           0       1.00      1.00      1.00        15
           1       0.87      0.93      0.90        14
           2       0.93      0.88      0.90        16

    accuracy                           0.93        45
   macro avg       0.93      0.93      0.93        45
weighted avg 0.93 0.93 0.93 45'파이썬 > Tensorflow,Pytorch' 카테고리의 다른 글
| 파이썬으로 RNN 구현하기 (0) | 2022.12.14 |
|---|---|
| 순환 신경망(Recurrent Neural Network, RNN) (1) | 2022.12.14 |
| Error Could not locate zlibwapi.dll. Please make sure it is in your library path (0) | 2022.12.13 |
| error ModuleNotFoundError: No module named 'tensorflow.keras' (1) | 2022.12.13 |
| Pycharm, Jupyter notebook에 딥러닝(tensorflow,pytorch)-GPU 환경구축(CUDA설치) (0) | 2022.12.13 |