반응형
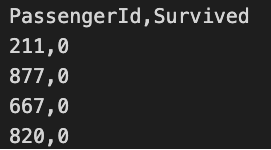
학습용 데이터(train)을 이용하여 생존 예측 모형을 만든 후, 이를 평가용 데이터(x_test)에 적용하여 얻은 예측값을 다음과 같은 형식의 CSV파일로 생성하시오(제출한 모델의 성능은 accuracy 평가지표에 따라 채점)
train.csv
0.06MB
x_test.csv
0.03MB
y_test.csv
0.00MB

train 데이터를 7:3비율로 train set, validation set 으로 나눠서 하이퍼파라미터를 튜닝하고 좋은모델을 만든다.
그 모델을 x_test셋에 적용해서 예측결과와 y_test(정답, 실제 시험에서는 없음)와 비교한다.
예측결과.csv 출력형태

모델은 성능도좋고 분류,회귀 모델 둘다 가능한 랜덤포레스트로 연습을 한다.
이 문제는 생존여부니까 분류 문제이다.
데이터호출
library(dplyr)
library(randomForest)
library(ModelMetrics)
df<-read.csv('../input/titanic/train.csv')
test<-read.csv('../input/titanic/x_test.csv')
y_test<-read.csv('../input/titanic/y_test.csv')
EDA
colSums(is.na(df)) #age컬럼에 결측값 있음
summary(df)
str(df)
PassengerId0Survived0Pclass0Name0Sex0Age177SibSp0Parch0Ticket0Fare0Cabin0Embarked0
PassengerId Survived Pclass Name
Min. : 1.0 Min. :0.0000 Min. :1.000 Length:891
1st Qu.:223.5 1st Qu.:0.0000 1st Qu.:2.000 Class :character
Median :446.0 Median :0.0000 Median :3.000 Mode :character
Mean :446.0 Mean :0.3838 Mean :2.309
3rd Qu.:668.5 3rd Qu.:1.0000 3rd Qu.:3.000
Max. :891.0 Max. :1.0000 Max. :3.000
Sex Age SibSp Parch
Length:891 Min. : 0.42 Min. :0.000 Min. :0.0000
Class :character 1st Qu.:20.12 1st Qu.:0.000 1st Qu.:0.0000
Mode :character Median :28.00 Median :0.000 Median :0.0000
Mean :29.70 Mean :0.523 Mean :0.3816
3rd Qu.:38.00 3rd Qu.:1.000 3rd Qu.:0.0000
Max. :80.00 Max. :8.000 Max. :6.0000
NA's :177
Ticket Fare Cabin Embarked
Length:891 Min. : 0.00 Length:891 Length:891
Class :character 1st Qu.: 7.91 Class :character Class :character
Mode :character Median : 14.45 Mode :character Mode :character
Mean : 32.20
3rd Qu.: 31.00
Max. :512.33
'data.frame': 891 obs. of 12 variables:
$ PassengerId: int 1 2 3 4 5 6 7 8 9 10 ...
$ Survived : int 0 1 1 1 0 0 0 0 1 1 ...
$ Pclass : int 3 1 3 1 3 3 1 3 3 2 ...
$ Name : chr "Braund, Mr. Owen Harris" "Cumings, Mrs. John Bradley (Florence Briggs Thayer)" "Heikkinen, Miss. Laina" "Futrelle, Mrs. Jacques Heath (Lily May Peel)" ...
$ Sex : chr "male" "female" "female" "female" ...
$ Age : num 22 38 26 35 35 NA 54 2 27 14 ...
$ SibSp : int 1 1 0 1 0 0 0 3 0 1 ...
$ Parch : int 0 0 0 0 0 0 0 1 2 0 ...
$ Ticket : chr "A/5 21171" "PC 17599" "STON/O2. 3101282" "113803" ...
$ Fare : num 7.25 71.28 7.92 53.1 8.05 ...
$ Cabin : chr "" "C85" "" "C123" ...
$ Embarked : chr "S" "C" "S" "S" ...
전처리
#범주형 변수 factor형으로 변환(레이블인코딩)
df$Sex<-as.factor(df$Sex)
df$Embarked<-as.factor(df$Embarked)
df$Survived<-as.factor(df$Survived)
df$Pclass<-as.factor(df$Pclass)

test$Sex<-as.factor(test$Sex)
test$Embarked<-as.factor(test$Embarked)
test$Pclass<-as.factor(test$Pclass)

#age 결측값 중앙값으로대체
df$Age<-coalesce(df$Age,median(df$Age,na.rm=T))
test$Age<-coalesce(test$Age,median(test$Age,na.rm=T))

#name,ticket,cabin은 범주형 변수인데 차원이 너무 많아서 삭제
df<-df[,-c(4,9,11)]
test<-test[,-c(3,8,10)]

#train셋 7:3비율로 train,validation 나눔
idx<-sample((1:nrow(df)),nrow(df)*0.7)
x_train<-df[idx,]
x_test<-df[-idx,]
모델 생성, 예측
m<-randomForest(Survived~.-(PassengerId),data=x_train, ntree=100)
p=predict(m,x_test)
모델 평가
result<-caret::confusionMatrix(x_test$Survived, p)$overall[1]
result
Accuracy: 0.727611940298508
최종 모델 생성 및 예측
m1<-randomForest(Survived~.-(PassengerId),data=df, ntree=100)
p1=predict(m1,test)
최종모델 예측 평가
result<-caret::confusionMatrix(p1, as.factor(y_test$Survived))$overall[1]
result
Accuracy: 0.654676258992806
csv파일 제출 및 확인
ans<-cbind('PassengerId'=test$PassengerId,'Survived'=p1)
write.csv(ans,"result.csv",row.names=F)
confirm<-read.csv("result.csv")
head(confirm)
A data.frame: 6 × 2
PassengerId Survived
<int> <int>
1 892 1
2 893 1
3 894 1
4 895 1
5 896 1
6 897 1'R > 빅분기 실기(독학)' 카테고리의 다른 글
| R 빅데이터분석기사 실기 작업형2(보험료 예측) 소스 코드 26일차 빅분기 독학 (6) | 2022.12.20 |
|---|---|
| R 빅데이터분석기사 실기 작업형1(시차 데이터 생성) 24일차 빅분기 독학 (0) | 2022.12.18 |
| R 빅데이터분석기사 실기 작업형1(중복 데이터 제거) 23일차 빅분기 독학 (0) | 2022.12.18 |
| R 빅데이터분석기사 실기 작업형1(시계열 주간) 22일차 빅분기 독학 (0) | 2022.12.18 |
| R 빅데이터분석기사 실기 작업형1(구간 분할) 21일차 빅분기 독학 (0) | 2022.12.18 |